NobleProg delivers high-quality Data Visualisation training courses in Berlin, the dynamic heart of Germany's tech and innovation sector. Participants benefit from expert-led instruction tailored to the professional needs of the capital's diverse industry landscape. Join our Berlin-based programs to enhance your skills with hands-on learning experiences in a world-class urban environment.
Whether conducted online or on-site, our instructor-led live Data Visualisation training courses combine discussion with hands-on practice to demonstrate the skills, strategies, tools, and approaches necessary for visualising and reporting data to diverse audiences. Case studies are analysed and discussed to illustrate how data visualisation solutions are applied in real-world scenarios to derive meaningful insights and answer critical questions..
Data Visualisation training is offered as either "online live training" or "onsite live training". Online live training, also known as "remote live training", is delivered via an interactive remote desktop. Onsite live training can take place locally at customer premises in Berlin or within NobleProg corporate training centers in Berlin.
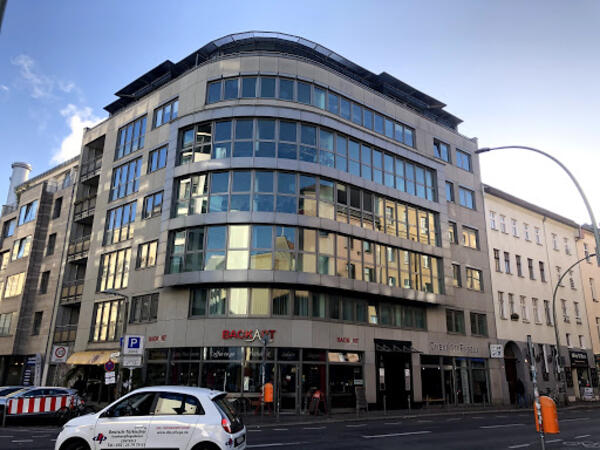
Our training facilities are located at Brückenstr. 4 in Berlin. Located on the fourth floor of a well-kept office building, our premises offer enough space for successful training courses in the heart of Berlin, within walking distance of the Jannowitzbrücke station.
Directions
The NobleProg training facilities are located in the heart of Berlin's Mitte district, just one underground station from Alexanderplatz, one of the centres of this vibrant city. By public transport you can reach us either by underground line U8 to Jannowitzbrücke station, followed by about 100 meters on foot.
Parking
Cars can be parked in the area along Brückenstr. and the nearby side streets, even if you may have to search for a moment. There is no charge for parking.
Local Amenities
Around the Rosenthaler Platz there are numerous small restaurants and shops where you can eat well and cheaply. There are also some hotels close by if you need accommodation for the training.
Our training facilities are located at Dianastrasse 46 in Potsdam-Babelsberg.
Our spacious training rooms are located directly opposite the Filmstudios Babelsberg and offer optimal training conditions for your needs.
Arrival
The NobleProg training facilities are conveniently located near the Medienstadt Babelsberg railway station,
and the A115 motorway is also easily accessible.
Parking
Parking is available in the surrounding streets around our training rooms.
Local Services
Potsdam offers numerous hotels and restaurants and is easily accessible thanks to its well-developed public transport system.
Instructor-led training in Berlin for advanced IT professionals to master Grafana and Prometheus integration. Participants will configure production setups, connect diverse data sources, build advanced dashboards with variables, and implement robust alerting systems within distributed environments.
This instructor-led, live training in Berlin (online or onsite) is aimed at intermediate-level Grafana users who wish to build interactive, drill-down dashboards with dynamic thresholds and contextual updates.
By the end of this training, participants will be able to:
Create dashboards that respond to user interactions, such as clicking a graph bar
Implement visual drill-downs that update in-place (without new tabs)
Configure pie charts and detailed panels based on selection filters
Use dynamic thresholds that react to user input and real-time data
This instructor-led, live training in Berlin (online or onsite) targets intermediate-level system administrators and monitoring professionals who aim to utilize Grafana for implementing monitoring solutions, overseeing dashboards, and setting up alerts.
By the end of this training, participants will have the ability to:
Differentiate between observability and monitoring.
Install and set up the Grafana server.
Configure and link various data sources, including Prometheus, InfluxDB, and ElasticSearch.
Create, manage, and customize dashboards and charts.
Utilize variables and queries to develop dynamic dashboards.
Configure notifications and alerts via Grafana.
Install and manage plugins to expand Grafana’s functionality.
This live, instructor-led course, delivered in Berlin (either virtually or in person), is designed for experienced DevOps engineers and SREs looking to master the management and scaling of Prometheus and Grafana in massive environments.
By the time this training concludes, participants will be equipped to:
Structure Prometheus and Grafana implementations for large-scale, distributed contexts.
Fine-tune Prometheus for optimal performance under heavy traffic loads.
Configure Grafana to process large volumes of data and complex visual outputs.
Execute advanced troubleshooting techniques and scalability plans.
This instructor-led, live training is conducted in Berlin (either online or onsite) and is specifically designed for intermediate-level developers and DevOps engineers aiming to instrument their applications for effective custom metric export and monitoring using Prometheus and Grafana.
By the conclusion of this program, participants will be equipped to:
Recognize the value of custom metrics in enhancing application monitoring.
Implement instrumentation to export custom metrics for Prometheus.
Build and fine-tune Grafana dashboards for clear custom metric visualization.
Apply proven best practices for integrating monitoring strategies into the development lifecycle.
This live, instructor-led training is conducted Berlin (online or onsite) and targets advanced Kubernetes administrators and DevOps engineers seeking to improve their monitoring expertise using Prometheus and Grafana.
By the conclusion of this program, participants will be capable of:
Setting up Prometheus and Grafana for Kubernetes monitoring.
Monitoring critical metrics for pods, nodes, and services.
Building dynamic dashboards to visualize cluster health and performance.
Implementing alerting strategies to resolve issues proactively.
Applying best practices for scaling monitoring solutions in Kubernetes environments.
This live, instructor-led training in Berlin (online or on-site) is tailored for senior DevOps and SRE specialists seeking to refine their alerting and automation expertise using Grafana and Prometheus.
By the conclusion of this program, participants will have the capability to:
Develop and administer advanced alerting rules in Prometheus.
Link Prometheus Alertmanager with external applications using webhooks.
Accelerate problem resolution by automating alert handling.
Effectively monitor and manage alerts through Grafana visualizations.
This live, instructor-led training in Berlin (online or on-site) is tailored for intermediate-level cloud and DevOps engineers aiming to improve cloud observability through Grafana and Prometheus.
By the conclusion of the program, attendees will be capable of:
Appreciating the merits of integrating Grafana and Prometheus with cloud platforms.
Deploying Prometheus for the supervision of cloud-based resources.
Configuring Grafana to render visual insights into cloud service metrics.
Applying cloud-native tools and integrations to enhance monitoring scalability.
This instructor-led, live training session, conducted in Berlin (either online or on-site), is tailored for intermediate-level DevOps and SRE professionals aiming to build impactful dashboards and enhance their monitoring strategies with Grafana and Prometheus.
By the conclusion of this training, participants will have the ability to:
Grasp best practices for designing high-performance dashboards.
Develop and configure advanced Grafana dashboard elements.
Apply Grafana templating to create dynamic and reusable dashboards.
Establish alerting frameworks to improve operational situational awareness.
This live, instructor-guided training, conducted in Berlin (either online or on-site), is tailored for junior system administrators and DevOps engineers looking to strengthen their monitoring capabilities using Grafana and Prometheus.
By the conclusion of this session, learners will have the ability to:
Appreciate the critical role of monitoring in IT settings.
Install and set up Grafana and Prometheus for standard monitoring operations.
Develop basic dashboards and alerts to present system performance data.
Follow established best practices for ensuring system reliability and efficiency.
This live, instructor-led training conducted in Berlin (online or onsite) is designed for beginner data scientists seeking to master the creation of significant and visually compelling data visualizations.
By the conclusion of this program, participants will be able to:
Configure and operate Google Colab for visualization tasks.
Generate a variety of plot types using Matplotlib.
Apply Seaborn to execute advanced visualization methods.
Adjust plot designs to enhance presentation quality and clarity.
Analyze and communicate data insights effectively through visual tools.
This live, instructor-led session in Berlin (delivered online or onsite) is tailored for beginner-level IT experts and DevOps practitioners seeking to master the fundamentals of Grafana and Prometheus.
Following this training, participants will be equipped to:
Understand the role and core features of Grafana and Prometheus.
Install and set up Grafana and Prometheus on a Linux platform.
Define basic data sources and build dashboards in Grafana.
Monitor system metrics and visualize data through Prometheus.
This instructor-led ELK Stack training in Berlin empowers intermediate IT professionals to master advanced log management, ingestion, and real-time analysis. Learners will acquire hands-on skills in Elasticsearch, Logstash, Kibana, and Beats to construct dashboards, automate alerts, and secure their environments.
This live, instructor-led training in Berlin (offered online or on-site) is tailored for intermediate-level administrators and developers seeking to refine their expertise in Elasticsearch administration. It emphasizes advanced Kibana dashboard development techniques and essential system maintenance procedures.
By the conclusion of the course, attendees will have the capability to:
Establish and configure Elasticsearch and Kibana environments suited for advanced administration and dashboard construction.
Manage the creation and maintenance of Elasticsearch indices, mappings, and data structures.
Formulate sophisticated queries and filters to uncover valuable insights within Elasticsearch data.
Build interactive Kibana dashboards utilizing a variety of visualization types and design techniques.
Execute best practices for the administration, optimization, and troubleshooting of Elasticsearch and Kibana.
This instructor-led course on Berlin empowers intermediate professionals with the capabilities to manage, evaluate, and visualize data for enhanced decision-making. Learners will acquire skills in constructing databases, applying statistical models, and generating dynamic dashboards via Excel and Power BI.
This instructor-led live training, conducted in Berlin (either online or on-site), is tailored for intermediate-level data analysts looking to master the advanced features and components of Grafana for sophisticated data visualization and analysis.
By the conclusion of this training, participants will be equipped to:
Acquire a deep understanding of advanced Grafana concepts and structural components.
Utilize template variables and dynamic dashboards to enhance data visualization strategies.
Execute complex queries leveraging the Grafana Query Language.
Implement best practices for scaling Grafana, optimizing performance, and ensuring high availability.
This instructor-led, live training in Berlin, offered online or on-site, is designed for data analysts who aim to build analytic applications using Python with Plotly and Dash.
By the end of this training, participants will be able to:
Set up real-time interactive dashboards for streaming live-updating data.
Create interactive dashboards using Python for data science solutions.
Secure interactive dashboards using advanced authentication methods.
This live, instructor-led training in Berlin is tailored for system administrators seeking to deploy an ELK stack (Elasticsearch, Logstash, Kibana). Please note that a minimum of three delegates is required for this course to proceed.
The session begins with an in-depth look at ELK architecture and capabilities, progressing to live laboratory practice. Practical exercises form a vital part of the learning experience, providing participants with the opportunity to implement their skills while receiving real-time feedback on their advancement.
Delivered by an instructor, this live training—available either onsite or remotely in Berlin—is tailored for data analysts looking to leverage Grafana for data monitoring and visualization.
By the conclusion of this program, participants will have the capability to:
Prepare the necessary development environment for creating visualizations in Grafana.
Implement high availability settings for Grafana.
Personalize panels and dashboards to present data effectively.
Set up a reverse proxy to enhance loading performance.
Explore the process of creating interactive dashboards using Power BI. You will learn to manipulate data, develop visual reports, and oversee sharing protocols within Berlin. This course addresses key competencies such as data connectors, advanced filtering, and best practices for robust business intelligence and organization-wide accessibility.
In this instructor-led live training, conducted in Berlin either onsite or remotely, participants will learn to utilize Microsoft Power BI for data analysis and visualization using a set of sample datasets.
By the end of the session, participants will be able to:
Create visually compelling dashboards that offer valuable insights into data.
Retrieve and integrate data from multiple sources.
This instructor-led live training in Berlin (online or onsite) is tailored for developers looking to utilize BusinessEvents and ActiveMatrix Service Bus to create, deploy, and maintain event-driven applications.
By the conclusion of this program, participants will have the ability to:
Configure the essential development environment to begin work.
This four-day training module in Berlin transitions beginners from foundational Tableau concepts to sophisticated data visualization techniques. You will master data connection strategies, calculation development, dashboard construction, and insight publishing. The curriculum includes practical labs and a culminating project designed to sharpen your analytical capabilities.
Read more...
Last Updated:
Testimonials (5)
Smart work reporting criteria
Siyabonga Kubeka - NTCSA
Course - Power BI for Business Analysts
workshops, practical examples
Martin Stuparek - Orange Slovensko, a.s.
Course - Monitoring with Grafana
The content is very helpful, and the trainer makes it more easier to understand
Ibrahim Al mayahi - Vastech SA
Course - Advanced Elasticsearch and Kibana Administration
- Building dashboards
- Learning the counts and SUMs and SWITCH
-
Thereso - South African National AIDS Council Trust
Course - Power BI Dashboards
The joyful atmosphere, the openness of the knowledgeable trainer who offered us a lot of tips and tricks.
Online Data Visualisation training in Berlin, Data Visualisation training courses in Berlin, Weekend Data Visualisation courses in Berlin, Evening Data Visualisation training in Berlin, Data Visualisation instructor-led in Berlin, Data Visualisation on-site in Berlin, Data Visualisation private courses in Berlin, Data Visualisation one on one training in Berlin, Data Visualisation boot camp in Berlin, Data Visualisation instructor in Berlin, Data Visualisation classes in Berlin, Data Visualisation instructor-led in Berlin, Data Visualisation coaching in Berlin, Weekend Data Visualisation training in Berlin, Online Data Visualisation training in Berlin, Evening Data Visualisation courses in Berlin, Data Visualisation trainer in Berlin